|
| Расположение в меню |
|---|
| Plot → Сохранить диаграмму |
| Верстаки |
| Plot |
| Быстрые клавиши |
| отсутствуют |
| См. также |
| ... |
Description
Plot save tool saves the active plot at desired location. With this tool you can also select the size and resolution of output image.
How to use
Select the plot tab that you want to save, and run this tool. Use path selector button in order to show a file dialog where you can choose the output image place and format.
Options
- File path: You can set the output image path (including format extension) inserting it at text line too.
- Size: You can specify output image width and height (inches).
- dpi: You can set the image resolution (Dots Per Inch). Final resolution (in pixels) will be the multiplication of width and height by dpi.
Scripting
Plot save tool can be used in macros and from Python console by using the following function:
save(str, (float, float), float) : Saves the plot at path, width the size specified in inches, and the resolution specified in Dots Per Inch.
Example:
import Plot
Plot.save("~/example.pdf", (12.8, 9.6), 50)
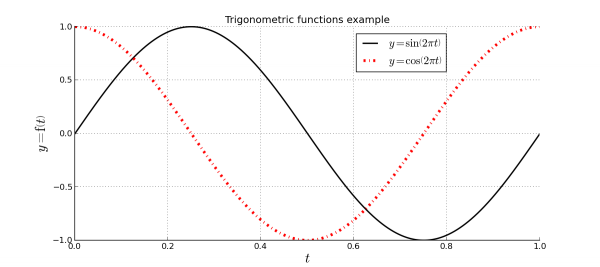
That will save a pdf image of 12.8x9.6 inches, with 640x480 pixels.
